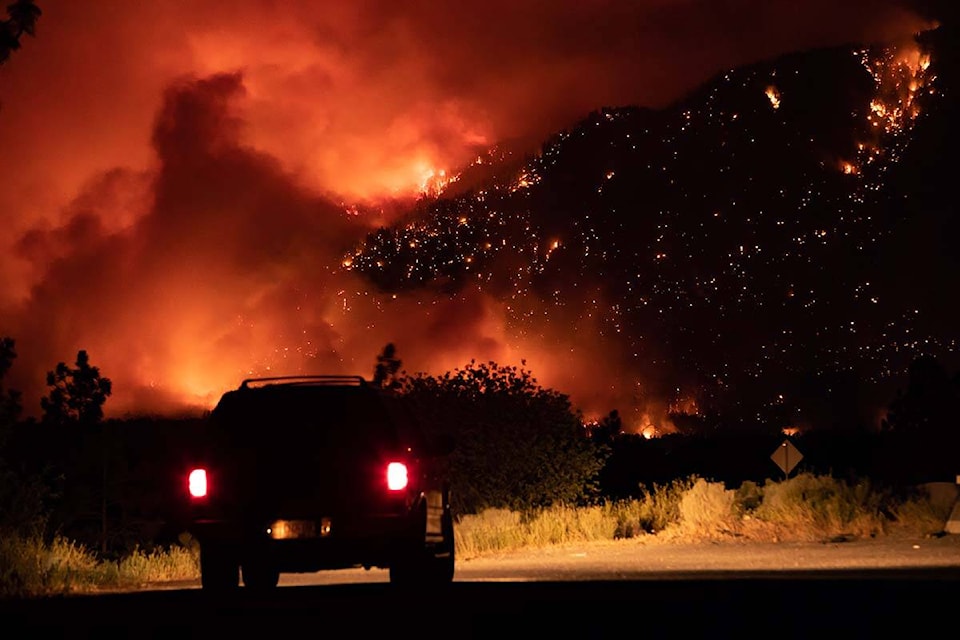
B.C. is beginning to launch an online fire-risk dashboard this summer in an effort to combat an increasing number of fire-related deaths.
Constructed in partnership with Statistics Canada, the Community Fire Risk Reduction Dashboard will allow local governments and fire departments to target resources and education campaigns to regions or neighbourhoods known to be at a greater risk.
One main focus of it will be to lower the number of home fires, which B.C.’s fire commissioner Brian Godlonton said make up a large per cent of overall provincial blazes.
In 2021, there were 9,166 fires resulting in 180 injuries and 59 deaths, according to the Office of the Fire Commissioner’s annual report released Wednesday (June 8). It’s an increase of seven deaths over 2020 and 32 over 2019.
Of 2021 fires, 2,751 were residential structure fires, accounting for 118 of the 180 injuries and 36 of the 59 deaths.
Godlonton said in 58% of those home fires, there was no working fire alarm. Most often, the fires were started by cooking equipment (39 injuries and three deaths), and smoking materials or open flames (44 injuries and eight deaths).
Another concern is the overrepresentation of older people in fire-related deaths. In the last five years, people over age 65 were 30 per cent more likely than other age categories to die in a fire, Godlonton said.
Age is one of many factors the new dashboard will take into account when determining at-risk areas, Godlonton said. Geographic region is another.
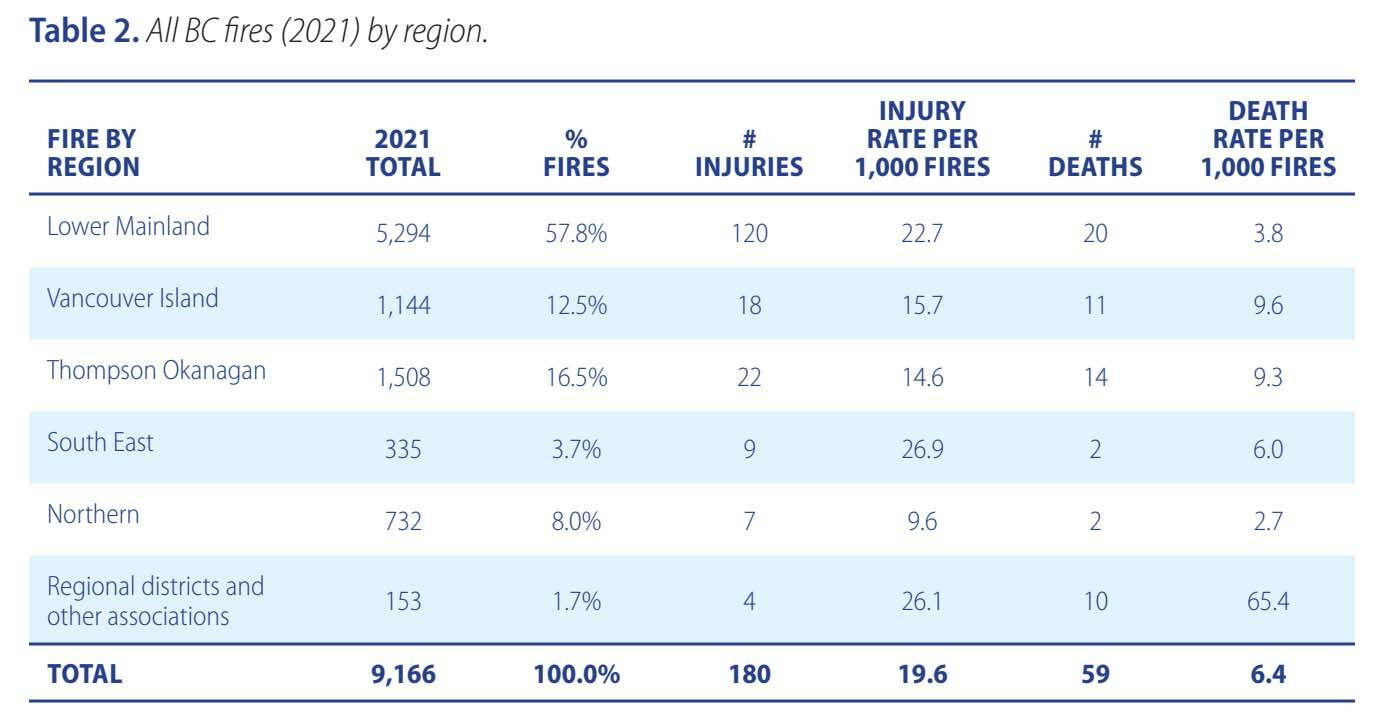
In 2021, 57.8 per cent of fires occurred in the Lower Mainland, 12.5 per cent were on Vancouver Island, 16.5 per cent were in the Thompson Okanagan region, eight per cent were in northern B.C., 3.7 per cent were in the south east region and 1.7 per cent were from other agencies. The highest death rates per 1,000 fires in the main five regions were on Vancouver Island and in the Thompson Okanagan region.
The dashboard will combine this kind of data from the Office of the Fire Commissioner with Statistics Canada data going back to 2016 to make its risk determinations. Godlonton said the Council of Canadian Fire Marshals and Fire Commissioners is also examining coroner and medical examiner data to better understand the causes of fire-related deaths.
The dashboard will first be rolled out in Coquitlam, Surrey, and Port Alberni in July, before gradually making its way into the rest of the province by early 2023.
@janeskrypnek
jane.skrypnek@bpdigital.ca
Like us on Facebook and follow us on Twitter.